|
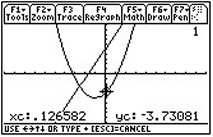
To get the GRAPH
screen:
green diamond and
F2 after entering expressions
into Y=.
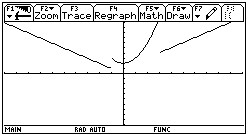
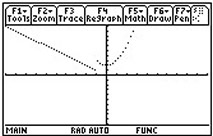
What is available from this graphing screen?
|
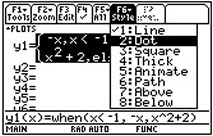
F2 - ZOOM
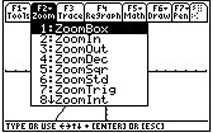
#6 Zoom Standard creates
a 10 x 10 pixel window. |
F3 Trace, F4 Re-draw
|
| F5 - Math
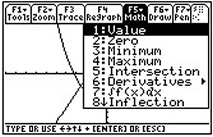
|
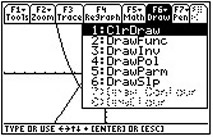
F6 -
Draw Commands
 |
F7 - Pencil
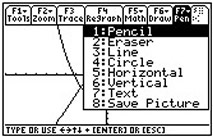
|
|
Algebra and
Composition of Functions |
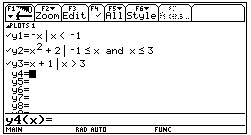
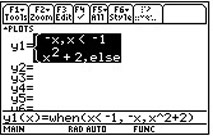
Remember to get the Y1 variables from the VAR
menu. |
Example:
 |
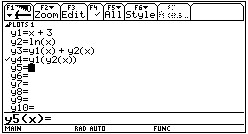
Note the syntax for entering the functions. |
|
Hint: Composition of functions: It is possible that
g(f (x)) may give an error if DEFINE is
used. If this problem occurs, try to define f and g
using a variable other than x (such as a), and then
use x for the composition. |
|
|
|
|
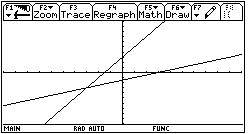
Graph the inverse of
f (x) = 2x + 3.
Enter f (x) into Y1.
From the Graph Screen, choose F6,
#3 DrawInv (or use
Catalog)
From the Home Screen, DrawInv
Y1(x).
ENTER.
Remember that Y1 is obtained from 2nd VARS above the
subtraction key.
 |
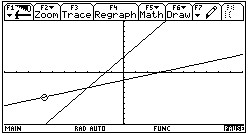
Or check to see if your algebraic inverse answer is
correct.
1. Enter f (x) into Y1.
2. Enter your algebraic inverse answer into
Y2.
3. Turn off Y2
4. DrawInv Y1(x)
5. Turn on Y2 with bubble
animation
6. Graph
If your answer is correct the bubble will follow the path of the
drawn inverse.
 |

Return to Open Page for TI-89 Titanium |