|
Logarithmic Regression Model Example
|
Data:
The
data below show the average growth rates of 12 Weeping Higan
cherry trees planted in Washington, D.C. At the time
of planting, the trees were one year old and were all 6 feet
in height.
|
|
|
|
| Age of Tree
(in years) |
Height
(in feet) |
1 |
6 |
2 |
9.5 |
3 |
13 |
4 |
15 |
5 |
16.5 |
6 |
17.5 |
7 |
18.5 |
8 |
19 |
9 |
19.5 |
10 |
19.7 |
11 |
19.8 |
|
| Task: |
a.) |
Determine a
logarithmic
regression model equation to represent this data. |
| |
b.) |
Graph the new equation. |
| |
c.) |
Decide whether the new equation
is a "good fit" to represent this data. |
| |
d.) |
Interpolate: What was the
average height of the trees at one and one-half
years of age? (to the nearest tenth of
a foot) |
| |
e.) |
Extrapolate: What is the predicted
average height of the trees at 20 years of age?Is
this prediction realistic? (answer to the nearest tenth of a foot) |
| |
f.) |
Based upon
your observations of this data, what would you
predict to be the average height of a mature Higan
cherry tree, to the nearest foot? |
| |
g.) |
If the average
height of the trees is 10 feet, what is the age of
the trees to the nearest tenth of a year? |
|
Step 1.
Enter the data into the lists.
For basic entry of data, see Basic
Commands. |
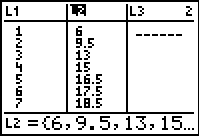
|
Step 2.
Create a scatter plot of the data.
Go to STATPLOT (2nd Y=)
and choose the first plot. Turn the plot
ON, set the icon to Scatter
Plot (the first one), set Xlist
to L1 and Ylist to
L2 (assuming that is where
you stored the data), and select a Mark of your choice.
  |
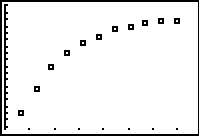
|
Step 3.
Choose Logarithmic Regression Model.
Press STAT, arrow right to
CALC, and arrow down to
9: LnReg. Hit
ENTER. When
LnReg appears on the home
screen, type the parameters L1,
L2, Y1. The Y1
will put the equation into Y=
for you.
(Y1 comes from VARS → YVARS, #Function, Y1)
  |
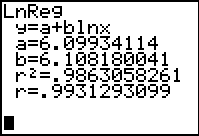
The logarithmic regression equation is

(answer to part a)
|
Step 4.
Graph the Exponential Regression Equation from
Y1.
ZOOM #9 ZoomStat to see
the graph. |
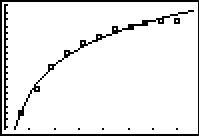
(answer to part b)
|
Step 5.
Is this model a "good fit"?
The correlation coefficient, r, is
.9931293099 which places the correlation into the
"strong" category. (0.8 or greater is a "strong"
correlation)
The coefficient of determination, r
2, is
.9863058261 which means
that 98.6% of the total variation in y can be
explained by the relationship between x and y.
Yes, it is a very "good fit".
(answer
to part c) |
 |
Step 6.
Interpolate: (within the data set)
What was the
average height of the trees at one and one-half years of
age? (to the nearest tenth of a foot)
The logarithmic regression equation is

where x stands for time.
Substituting 1.5 for x gives an average height of
8.57558088 feet or 8.6 feet.
(answer to part
d) |
Step 7. Extrapolate
data: (beyond data set)
What is the predicted
average height of the trees at 20 years of age? Is
this prediction realistic?
(answer to the nearest tenth
of a foot)
The logarithmic regression equation is

where x stands for time.
Substituting 20 for x gives an average height of
24.39693273 feet or 24.4 feet.
Extrapolations far from the stated data are often
inaccurate and unreliable. Nine years away from
the data set is a large span of time and the reading of
24.4 feet may be "high" based upon the observed leveling
nature of the last data entries.
(answer to part e) |
Step 8.
Based upon your
observations of this data, what would you predict to be
the average height of a mature Higan cherry tree, to the
nearest foot?
It can be seen from the graph that the growth
rate is slowing down (leveling off). Such a
slowing could be interpreted that the trees are reaching
their mature height. The twenty year prediction
shows a height of 24 feet. Any answer from 20 feet
to 24 feet would be an acceptable approximation.
While extrapolations far from the stated data are often
inaccurate, a reading closer to 20 feet may be more
accurate.
(In reality, Higan cherry trees,
depending upon the specific specie, reach a mature
height anywhere from 15 to 30 feet.)
(answer to part f) |
Step 9.
If the average height of
the tree is 10 feet, what is the age of the tree to the
nearest tenth of a year?
Use your table to
find the age:
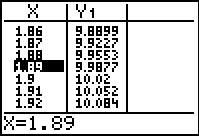
(answer to part g -- approx. 1.9
years of age) |
|


![]()