|
To
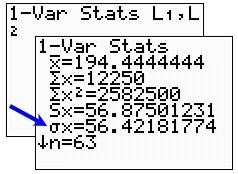
find standard deviation: Remember, we
are looking for "population"
form which will be found using 1-Var Stats.
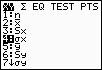
Enter the "Data Entry"
into L1 and the "Frequency"
into L2. Go to
one-variable stats
to find "population" standard deviation.
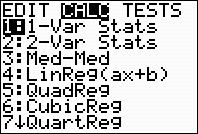
STAT → CALC #1 1-Var Stats
Be sure to use parameters L1, L2 to indicate both the values AND their
frequencies.
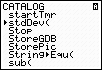
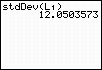
 NOTE! The standard
deviation found in the CATALOG,
stdDev, and also found by 2nd LIST
→ MATH #7 stdDev
are both Sample standard deviations.
NOTE! The standard
deviation found in the CATALOG,
stdDev, and also found by 2nd LIST
→ MATH #7 stdDev
are both Sample standard deviations.
|
|
|
= mean |
|
= sum of the data |
|
|
= sum of squares of the data |
|
|
= sample standard deviation |
|
|
= population standard deviation
|
|
n |
= sample size (# of pieces of data) |
|
|
= smallest data entry |
|
|
= first quartile |
|
|
= median (second quartile) |
|
|
= third quartile |
|
|
= largest data entry |
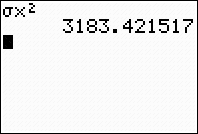
Population
Standard Deviation = 56.42 |


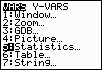
 symbol is under
VARS - #5 Statistics
symbol is under
VARS - #5 Statistics