|
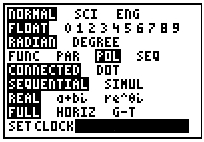
To graph an equation in polar form, set the
calculator MODE to polar (POL).→
|
If you want to see your TRACE
in terms of r and  ,
change FORMAT (2nd ZOOM) to PolarGC. ,
change FORMAT (2nd ZOOM) to PolarGC. |
 |
|
 |
|
Examples:
1. Graph  |
|
Enter the equation into Y=:
 |
Choose ZOOM #6 ZStandard |
|
Choosing #6 ZStandard
will set the window as follows:
with the x and y values in the normal -10 to10
configuration |
|
|
Graph
(using the ZOOM #6 ZStandard)
Because the Standard viewing window has a 3 to 2 aspect
ratio (it is not evenly divided on both axes)., the graphs may appear
slightly distorted. |
Graph
(using the ZOOM #5 ZSquare)
To prevent distortion,
choose ZOOM #5 ZSquare.
|
|
Choosing #5 ZSquare will
also set the window as follows:
but
with the x and y values in the -15.16129 to
15.16129
configuration. |
|
|
Trace
Notice that x and y are displayed. The calculator
FORMAT is set to the default value
of RectGC. |
Trace
Notice that r and are displayed. The calculator FORMAT is set to PolarGC.
|
 |
|

2. Graph 
Enter the equation into Y=:
 |
Choose ZOOM #5 ZSquare
 |
Trace
 |
3. Find r from
the graph screen of
when

You can find the value of a function from the graph screen in two
ways:
| Method 1: |
-- by using the VALUE function
in the CALC
(2nd TRACE) menu:
This screen will appear....
 |
If the FORMAT (2nd
ZOOM) is set to
RECTGC you will see the x and y coordinates...
If the FORMAT
is set to POLARGC
you will see the r and theta coordinates...
 |
| |
|
|
| Method 2: |
-- simply hit TRACE
and enter the
theta value right on the graphing screen.
 |
If the FORMAT
is set to POLARGC,
you will see the r value answser.
 |
|