Transformations - Rotations
About the Origin

Transformations - Rotations
About the Origin
Using the graphing calculator to examine transformations:
|
||
|
|
||
|
1. Clear
entries in the Y= positions (or turn them
off).
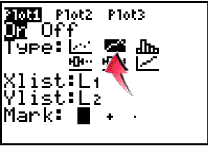
2. Turn on the Connected Graph icon under StatPlots. |
 |
|
|
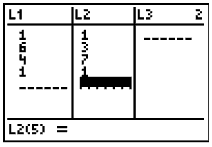
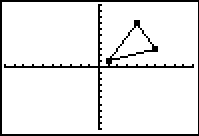
3. Enter values into L1 and L2. Enter the x-coordinate in L1 and its corresponding y-coordinate in L2. Enter the first coordinate again at the end to complete the connected drawing. (See Basic Commands for help entering data in lists.) The original triangle is now residing in Plot1. When graphing do NOT choose ZoomStat for the window. We want to have a coordinate axes for examining our transformations. Use a standard 10x10 window (ZStandard) for this problem. 4. We will be placing our transformation coordinates into L3 and our transformation figure will reside in Plot2. |
  |
|
|
|
||
Store the negated y-values into list L3. You can type them in yourself or let the calculator create the values. Arrow up ONTO L3 and enter -L2 (to negate the y-values). Press ENTER.
|
||
Store the negated x-values into list L3 and the negated y-values in L4. Under Plot 2, assign Xlist: L3 and Ylist: Y4. Graph.
|
||
Store the negated x-values into list L3. Under Plot 2, assign Xlist: L2 and Ylist: Y3. Graph. |
||
![]()
Finding Your Way Around
TABLE of CONTENTS