|
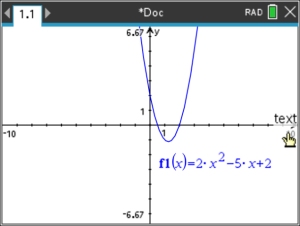
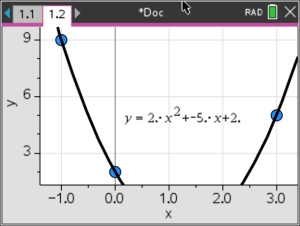
For this example, you are given the graph, one observable zero at x = 2, and two additional points. The task is to write a quadratic equation for this graph.
(In this case, the other zero between 0 and 1 cannot be identified.)
Write the equation of the
parabola shown at the right, given that the points (0,2),
(-1,9) and (3,5) are on the graph.
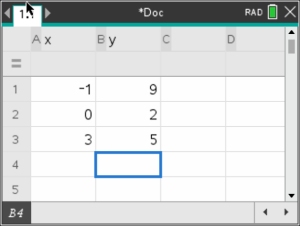
1. Think of the given points as creating a small table:
2. Open a new Document  . .
Choose #4 Add Lists & Spreadsheet. 
Enter data into list.
Title columns at top X and Y.
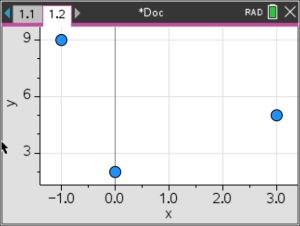
3. Insert another Document:  I I
Choose #5 Add Data & Statistics
A scatter plot will appear.
At bottom of screen, click and choose X.
At left of screen, click and choose Y.
4. Choose from 
#4 Analyze, # 6 Regression, #4 Show Quadratic.
The graph of the quadratic and the quadratic regression equation for the data will appear.
5. ANSWER: y = 2x2 + 5x + 2 |
Given:
 (0,2), (-1,9) and (3,5)
|