Working with Parabolas
|
| Solve the
following problem involving a parabola:
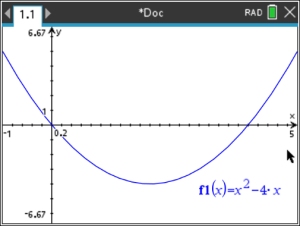
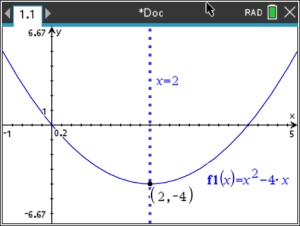
a. Graph the parabola y = x2 - 4x on the interval [-1, 5].
b. Find the turning point (the vertex).
c. Find the axis of symmetry.
d. Find the zeros (roots). |
|

a. Graph y = x2 - 4x on interval [-1, 5].
• From  start a New document start a New document
• Add Graph
• Enter the equation: f1(x) = x2 - 4x
• 
Adjust the window for interval [-1,5].
•  , #4 Window/Zoom, #1 Window Settings , #4 Window/Zoom, #1 Window Settings
Enter x-values from -1 to 5.
The y-values should not need adjusting.
|
|
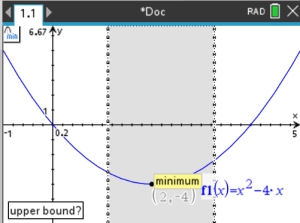
b. Find the turning point (the vertex).
If the parabola is opening upward, the turning point is called the minimum.
If the parabola is opening downward, the turning point is called the maximum.
This parabola is opening upward.
Locate the minimum.
• , #6 Analyze Graph, #2 Minimum
Scroll the pointing hand,  , near the left of the turning point. , near the left of the turning point.
• Click or  to lock in place. to lock in place.
• Continue scrolling to the right of the turning point.
• Click or to lock in place.
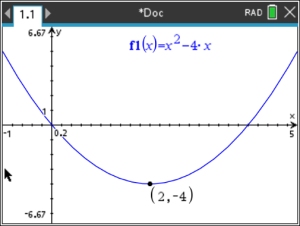
The minimum point will appear.
Minimum: (2,-4)
|
|
c. Find the axis of symmetry.
The axis of symmetry is the line over which the parabola is a mirror image of itself.
Once
you know the turning point, you know where the
axis of symmetry is located.
It passes through the turning
point.
For this example, the axis of
symmetry is x = 2.
There is no need
to graph the axis of symmetry on the calculator. |
|
|
If you want to see the axis of symmetry on your graph, you can:
• , #6 Analyze Graph, #8 Analyze Conic,
#4 Axes of Symmetry
Point to any location on the parabola and the axis of symmetry, with its equation, will appear.
|
 |
d. Find the zeros (roots).
To find
the zeros of a graph, you need to find the points at which the
graph crosses the x-axis.
• Use the ZERO option:
• , #6 Analyze Graph, #1 Zero
•
Scroll (not arrow) the pointing hand, , to the left of one of the zeros
• Click or , to lock the location.
This will be called the "lower bound".
• Now scroll to the right of the root, click or to lock the location
("upper bound").
• The root's coordinates
(0,0) will appear.
•
Repeat for the second root. |
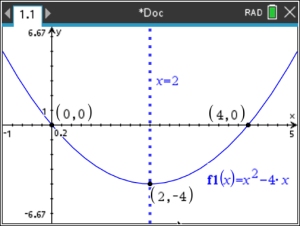
Zeros (roots) located at:
(0,0) and (4,0) |
|
|
|